THIS is what I love the most about the game industry, it’s full of talented people who are always willing to share their experiences and tools to help benefit others in the same industry. There is a large amount of similar problems we all run into during game development. Hence, sharing tools and knowledge is useful for the whole community.
Overview
To summarize, Insomniac Games are sharing IG-MemTrace (their in-house memory tracing tool) with the rest of the world. IG-MemTrace tool is split into two components, a network listener app written in C#, this one you use to record, parse, and analyze traces, and a C++ runtime component which should be integrated with the target code base.
Below are just some of the features (excerpt from their public GitHub repo)
- Lightweight C++ runtime component with network recording
- CRT heap hooking on Windows
- Full support for custom heaps and allocators
- Supports displaying and analyzing fragmentation for custom heaps
- Can display a delta between two arbitrary points in time
…Plus much more.
Memory Profiling in Unreal Engine 4
For memory profiling in UE4 you have a few options:
On the highest level you have the allocator stats – basically the kind of information you get after every level load – by default it should spit out logs similar to the following:
LogMemory: Memory total: Physical=63.9GB (64GB approx)
LogMemory: Platform Memory Stats for Windows
LogMemory: Process Physical Memory: 277.77 MB used, 277.77 MB peak
LogMemory: Process Virtual Memory: 282.28 MB used, 282.28 MB peak
LogMemory: Physical Memory: 13391.09 MB used, 65480.22 MB total
LogMemory: Virtual Memory: 669.84 MB used, 8388608.00 MB total
Next, there are multiple stat commands you can use to check some memory usage in run-time:
Stat Memory
Stat MemoryPlatform
Stat MemoryStaticMesh
Then there are multiple commands to dump memory-related data, a shortcut to do that is to use the memreport command (with optional -full additional argument for even more data). This in turn runs a list of pre-specified commands in sequence to dump different types of information (check BaseEngine.ini under MemReportCommands and MemReportFullCommands for more details). An example on how to use that could be found on Unreal’s Blog.
Finally, there’s the new and experimental stat-based memory profiler. Unfortunately the last time I checked in 4.13 it was not very usable because it adds considerable overhead during gameplay, takes a long time to parse the information, depends on the stat system, and can only dump the results to excel files.
So, what now?
For me, the required features for a memory profiler were:
- Covers both direct malloc calls as well as custom allocators
- Records allocation callstacks, which helps in both optimizing memory usage and tracking memory leaks
- Includes actor / component type per allocation when relevant
- Includes asset name / path per allocation when relevant
- Low to Moderate runtime overhead
- An external tool to display and manipulate the results, which has to be very responsive even when handling massive amount of data
- No dependency on Unreal’s stat system, for two reasons
- Due to the Stat system performance and memory overhead
- To be usable in Test and Shipping configurations
Plus some nice to have features:
- Ability to manually start / stop capturing multiple times per session
- Ability to automatically parse and upload results after capturing is done
Since IG-MemTrace has most of these features already, it sounded like a pretty good choice. So let’s see it in action!
Integration Steps
Copying Files
I decided to give IG-MemTrace a shot and see how the tool fares when integrated with Unreal Engine 4. The steps were pretty straightfoward,:
- Copy ig-memtrace\tool\ folder to MyGame\Source\Programs\
- Build the solution ig-memtrace\tool\MemTraceUI.sln using Visual Studio
- Copy .cpp files under ig-memtrace\runtime\ to Engine\Source\Runtime\Core\Private\IGMemTrace
- Copy .h files to Engine\Source\Rruntime\Core\Public\IGMemTrace
- Copy MinHook.x64.dll next to the application executable Engine\Binaries\Win64\ for editor builds, and MyGame\Binaries\Win64\ for non-editor (cooked) builds
Setup & Configuration
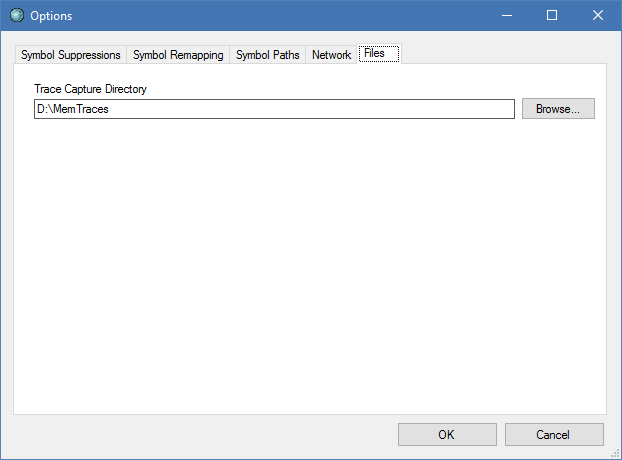
The first time you launch MemTrace UI tool (C# listener) you are presented with a dialog to change default options, you must set the Trace Capture Directory before continuing:
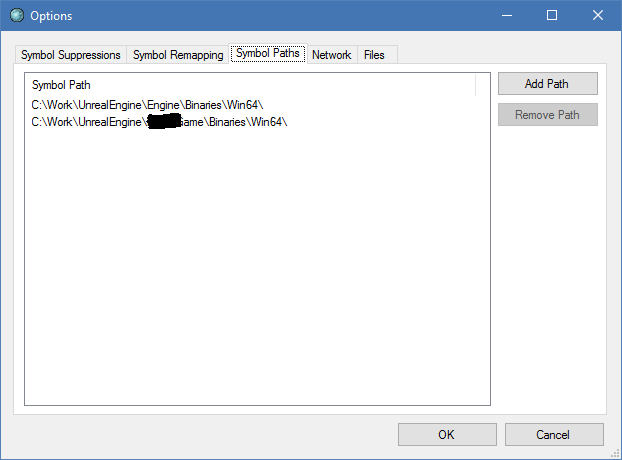
I also set up my Symbol Paths to the folders containing both the editor as well as the game executables as follows:
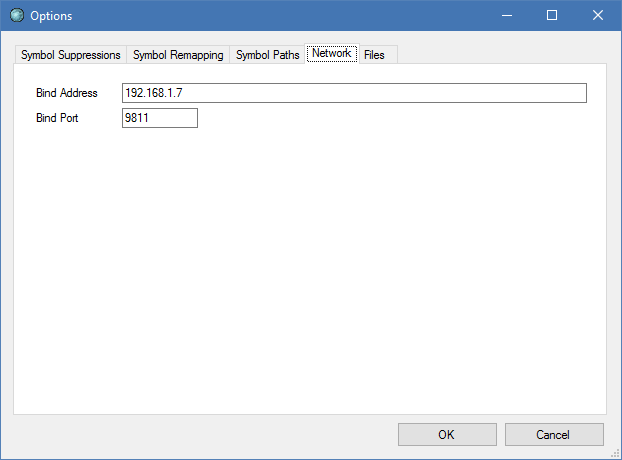
Finally set the Bind Address to the IP of the machine on which you are running the tool:
Next Steps
In the next blog post I will discuss the required code changes for integrating IG-MemTrace into UE4, explain the memory profiling workflow, and share my suggestions for future improvements. Stay tuned, and don’t forget to follow my Twitter to be notified when I post Part 2.