
Welcome to the second part of my series on integrating Insomniac Games MemTrace tool to Unreal Engine 4, if you have not read the first part, I recommend you do so here.
In today’s post I will be discussing the code changes I did, including the base integration as well extra improvements I added on top, explain how to use MemTrace with UE4, and finally share my suggestions for future improvements. So let’s start!
Code Changes
Make sure to first start by copying over files to your solution, you can check out how and where to copy files in part 1 here.
The code changes required to get IG-MemTrace integrated with Unreal Engine were very compact. I am currently on version 4.13 and below are the changes I did:
Engine\Source\Runtime\Core\Core.Build.cs
Add the following line to PublicIncludePaths
"Runtime/Core/Public/IGMemTrace",
Add the following code to the end of the constructor
if ((Target.Platform == UnrealTargetPlatform.Win64))
{
    if (UEBuildConfiguration.bCompileAgainstEngine && !UEBuildConfiguration.bBuildEditor && Target.Configuration != UnrealTargetConfiguration.Shipping)
    {
        Definitions.Add("MEMTRACE_ENABLE=1");
        PublicAdditionalLibraries.Add("psapi.lib");
    }
}
Engine\Source\Runtime\Core\Private\HAL\MallocBinned.cpp
Add the following lines right after the includes
#if MEMTRACE_ENABLE
#include "IGMemTrace/MemTrace.h"

int32 FMallocBinned::m_PoolAllocHeapId= 1;
int32 FMallocBinned::m_OSAllocHeapId= 2;
#endif // MEMTRACE_ENABLE
Add the following new function anywhere in the file
#if MEMTRACE_ENABLE
void FMallocBinned::InitializeHeaps()
{
    m_PoolAllocHeapId = MemTrace::HeapCreate("Pool Malloc");
    m_OSAllocHeapId = MemTrace::HeapCreate("OS Malloc");
}
#endif // MEMTRACE_ENABLE
Make the following changes in FMallocBinned::Malloc()
if( Size < BinnedSizeLimit )
{
...
    Free = Private::AllocateBlockFromPool(*this, Table, Pool, Alignment);
#if MEMTRACE_ENABLE // <-- new
    MemTrace::HeapAllocate(m_PoolAllocHeapId, Free, Size);  // <-- new
#endif // MEMTRACE_ENABLE // <-- new
...
}
&
else if ( ((Size >= BinnedSizeLimit && Size <= PagePoolTable[0].BlockSize) || (Size > PageSize && Size <= PagePoolTable[1].BlockSize)))
{
...
    Free = Private::AllocateBlockFromPool(*this, Table, Pool, Alignment);
#if MEMTRACE_ENABLE // <-- new
    MemTrace::HeapAllocate(m_PoolAllocHeapId, Free, Size);  // <-- new
#endif // MEMTRACE_ENABLE // <-- new
...
}
&
else
{
...
    Free = (FFreeMem*)Private::OSAlloc(*this, AlignedSize, ActualPoolSize);
    if( !Free )
    {
        Private::OutOfMemory(AlignedSize);
    }
#if MEMTRACE_ENABLE // <-- new
    MemTrace::HeapAllocate(m_OSAllocHeapId, Free, AlignedSize);  // <-- new
#endif // MEMTRACE_ENABLE // <-- new
}
Make the following changes in FMallocBinned::Realloc()
if( Ptr && NewSize )
{
...
    FMemory::Memmove(NewPtr, Ptr, NewSize);
#if MEMTRACE_ENABLE // <-- new
    MemTrace::HeapReallocate(m_PoolAllocHeapId, Ptr, NewPtr, NewSize);  // <-- new
#endif // MEMTRACE_ENABLE // <-- new
...
}
Make the following changes in FMallocBinned::Free()
...
#if MEMTRACE_ENABLE // <-- new
    MemTrace::HeapFree(m_PoolAllocHeapId, Ptr);  // <-- new
#endif // MEMTRACE_ENABLE // <-- new
    Private::PushFreeLockless(*this, Ptr);
Engine\Source\Runtime\Core\Public\HAL\MallocBinned.h
Make the following changes
    struct Private;
private:
#if MEMTRACE_ENABLE // <-- new
public:  // <-- new
    static void InitializeHeaps();  // <-- new
private: // <-- new
    static int32 m_PoolAllocHeapId; // <-- new
    static int32 m_OSAllocHeapId;   // <-- new
    static bool bHeapsInitialized;  // <-- new
#endif // MEMTRACE_ENABLE // <-- new
Engine\Source\Runtime\Launch\Private\LaunchEngineLoop.cpp
Make the following changes right after the includes
#if MEMTRACE_ENABLE // new
#include "MemTrace.h" // new
#include "MemTraceSys.h" // new
#include "MallocBinned.h" // new
#endif // MEMTRACE_ENABLE // new
To auto connect to the network listener on startup, I added the following to FEngineLoop::PreInit()
...
#if MEMTRACE_ENABLE // <-- new
    FString memTraceIP; // <-- new
    if (FParse::Value(FCommandLine::Get(), TEXT("MEMTRACEIP="), memTraceIP, false)) // <-- new
    { // <-- new
        int32 memTracePort = 9811; // <-- new
        FParse::Value(FCommandLine::Get(), TEXT("MEMTRACEPORT="), memTracePort); // <-- new

        MemTrace::InitSocket(memTraceIP.GetCharArray().GetData(), memTracePort); // <-- new
        FMallocBinned::InitializeHeaps(); // <-- new
    } // <-- new
#endif // MEMTRACE_ENABLE // <-- new
#if WITH_LAUNCHERCHECK
...
}
Make the following changes in the end of FEngineLoop::Exit()
void FEngineLoop::Exit()
{
...
    FIOSystem::Shutdown();
#if MEMTRACE_ENABLE // <-- new
    MemTrace::Shutdown(); // <-- new
#endif // MEMTRACE_ENABLE // <-- new
}
This way the game would connect to the network listener very early in the startup process, which facilitates capturing virtually all memory allocations during the lifetime of the game. However, you could use the function call I added above pretty much anywhere you like, so you have fine grain over when to start capturing memory allocations.
For example, I added the following exec function to the player controller class (or your own player controller if you override it, which is probably a better idea):
Engine\Source\Runtime\Engine\Classes\GameFramework\PlayerController.h
Add the following function declaration
#if MEMTRACE_ENABLE
    UFUNCTION(Exec)
    void StartMemTrace(FString ip, int32 port);

    UFUNCTION(Exec)
    void StopMemTrace();

    UFUNCTION(Exec)
    void MemTraceUserMark(FString userMark);
#endif // MEMTRACE_ENABLE
Engine\Source\Runtime\Engine\Private\PlayerController.cpp
Add the following code
#if MEMTRACE_ENABLE
#include "IGMemTrace/MemTrace.h"
#include "MallocBinned.h"

void APlayerController::StartMemTrace(FString ip, int32 port)
{
    MemTrace::InitSocket(ip.GetCharArray().GetData(), port);
    FMallocBinned::InitializeHeaps();
}

void APlayerController::StopMemTrace()
{
    MemTrace::Shutdown();
}

void APlayerController::MemTraceUserMark(FString userMark)
{
    MemTrace::UserMark(StringCast(*userMark).Get());
}
#endif // MEMTRACE_ENABLE
Engine\Source\Runtime\Core\Public\IGMemTrace\MemTrace.h
Change the default MEMTRACE_ENABLE define to the following
#ifndef MEMTRACE_ENABLE
#define MEMTRACE_ENABLE 0
#endif // MEMTRACE_ENABLE
This way I could easily start memory tracing whenever I want, for example before an interesting event happens: level load, specific gameplay feature gets activated, predefined time span… etc. For example, I could call the console command MemTraceUserMark mark1 before I do some specific action, then call the console command MemTraceUserMark mark2 afterwards. This way I would get two clear markers in MemTraceUI tool, I could also diff between the two marks to see allocations happening between them.
By default I could only connect to MemTrace tool once per run, and have to restart the game to be able to connect again which is frustrating. The fix for this is a minor change:
Engine\Source\Runtime\Core\Private\IGMemTrace\MemTrace.cpp
Add the following code
namespace MemTrace
{
...
    static const uint32_t kStreamMagic = 0xbfaf0003;

    // Guarantee one-time CRT hooking // <-- new
    static bool bCrtHooked = false; // <-- new
&
static void MemTrace::HookCrt()
{
    if (bCrtHooked) // <-- new
    { // <-- new
        return; // <-- new
    } // <-- new
    bCrtHooked = true; // <-- new
...
By doing the change above I was able to disconnect from MemTrace (using StopMemTrace console command or right click -> Stop Recording in MemTrace UI tool, and then reconnect again using StartMemTrace several times without having to restart the game. Not bad for 7 lines of code.
Recording Memory Allocations
To capture memory traces:
- Run MemTraceUI tool, you can find the executable under \UE4\MyGame\Source\Programs\MemTrace\bin\MemTraceTool.exe. You can choose one of two ways to trace memory allocations:
2a. Start the game with trace enabled
This allows you to capture all memory allocations since the very early start of the game. To do so, use the commandline -MEMTRACEIP=your_ip -MEMTRACEPORT=your_port (default port is 9811)
Note: Doing so will make the game very slow, for example with CookOnTheFly it will never finish loading
2b. Start the game normally
This enables you to determine when to actually start tracing if you want to focus on a more specific scenario. Use console command StartMemTrace to connect to the tool, you have to pass the IP and port to use (default port is 9811). For example StartMemTrace 10.0.0.210 9811
Note that the game will still be very slow during tracing, but at least you have control over when that happens.
All memory allocations will now be captured, once you want to stop tracing do one of the following:
- Right click the active trace file in the memory trace tool window and click Stop
- Use the console command StopMemTrace
- Close the game
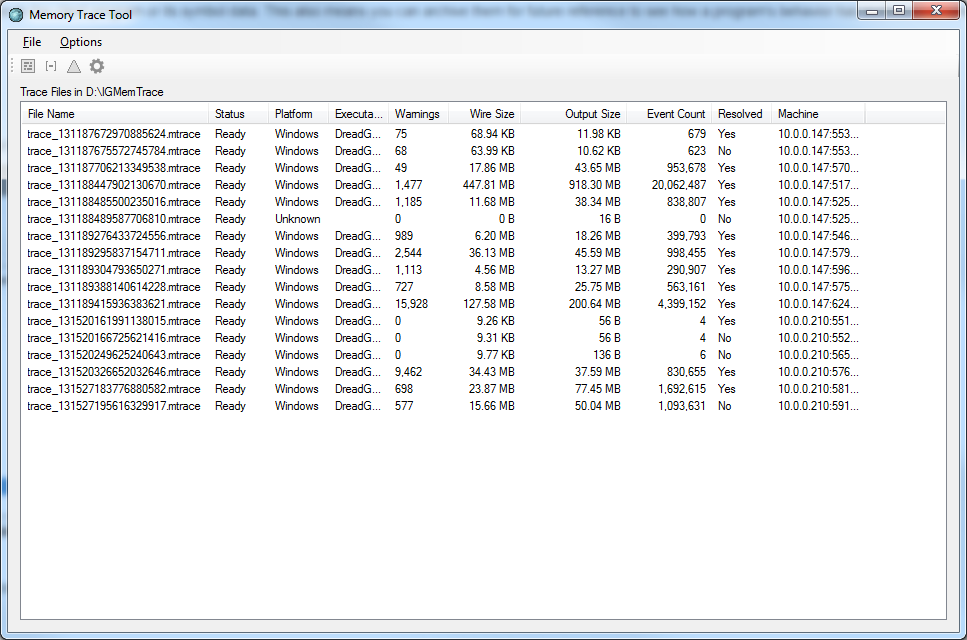
Capturing Trace Files
MemTrace main window shows statistics about the trace files being recorded. There is no limit to the number of files that can be concurrently recorded. You may record and analyze traces at the same time if desired.
Traces are named automatically, but may be renamed by double clicking the filename (or hitting F2) and typing in a replacement name.
Marks may be inserted into a running trace by right-clicking the trace file and selecting User Trace Mark. This is useful in cases where the client doesn’t have a UI or other logic that allows you to set a trace mark in some other way. Marks created in this way will be named “UI Mark N”, so they’re not super descriptive, but nevertheless useful.
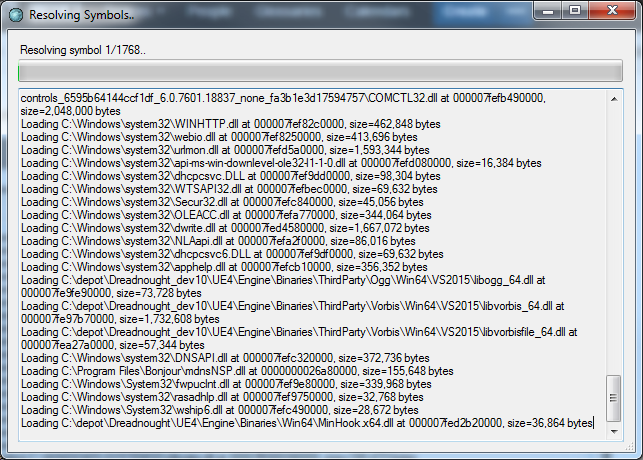
Resolving Symbols
With a completed trace file selected, click the little gear icon to bring up the symbol resolver. This will resolve symbols using the symbol options and store any resolved data back to the trace file. When the resolution has finished, just close the window.
Inspecting Memory State
With a completed trace file selected (preferably with symbols resolved if you want to make any sense of it!) click the heap view icon to bring up the heap visualizer.
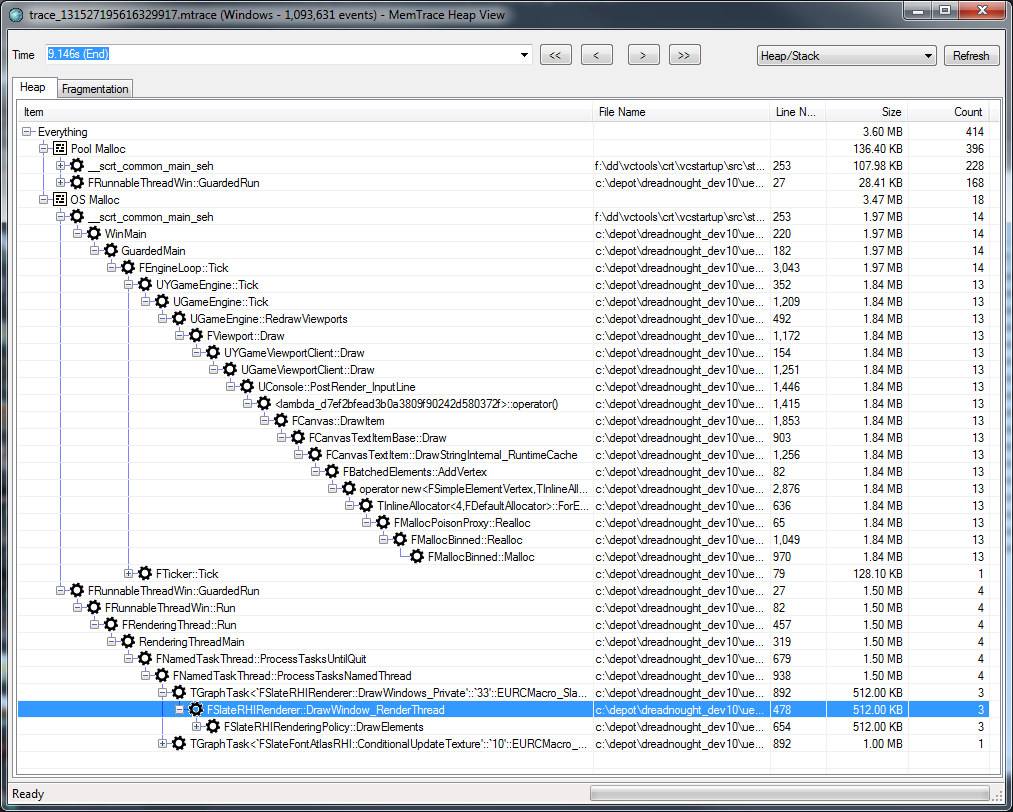
In the window above you can scrub the time back and forth to inspect the state of all heaps and allocators at that time. Marks are handy here as a shortcut to guide you to a point of interest, but you can pick an arbitrary point as well.
The tree view is populated with an aggregate view based on the current perspective. By default the view aggregates all allocations by heap/allocator and then by call stack. You can sort by any columns (although the UI is a little rough when scrubbing and can require a nudge to re-sort the data).
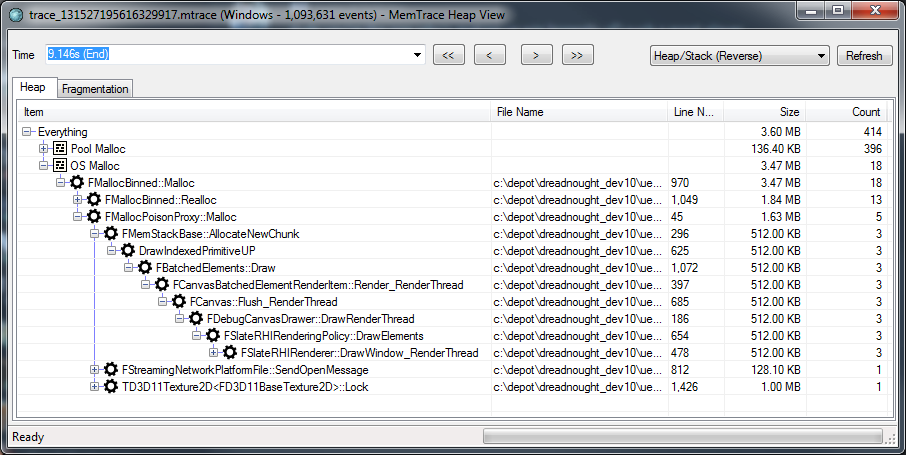
By using the perspective dropdown you to switch to a different perspective. For example, you can use Heap/Stack (Reverse) instead to check on a higher level where memory operations are going (malloc vs. realloc) as shown below:
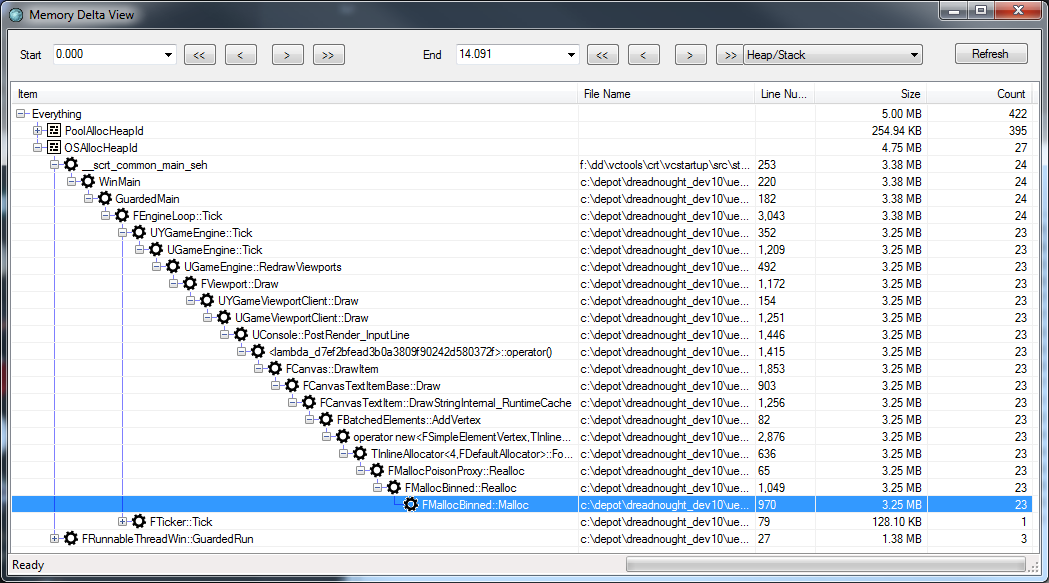
Inspecting Memory Deltas
The delta view is similar to the basic heap view, but will show you what was allocated between two points in time, but not freed. It’s an excellent tool to track down memory leaks, for example you can start tracing, add a mark, load a level, unload the level, add a mark, then compare both to check if there are leaked actors.
Searching for Allocation Owners
This tool is useful to be able to track down who previously owned a piece of memory that is involved in a memory overwrite.
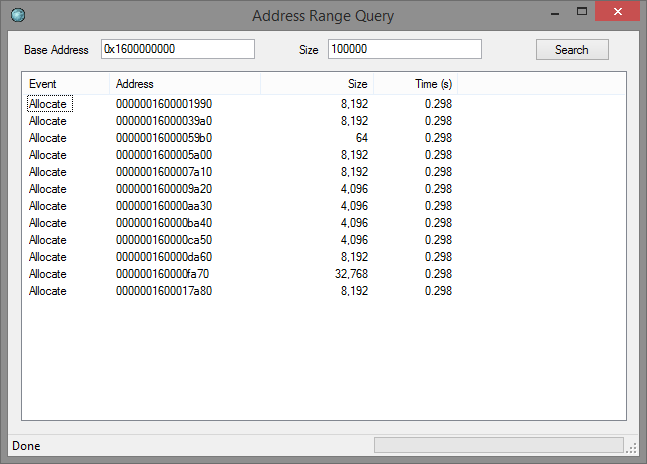
Input the address range you’re interested in and search. You’ll see a list of allocations that overlapped that range, sorted by lifetime. In order to see the callstack leading to Alloc / Free just hover over an item.
Conclusion and Future Thoughts
As you can see already MemTrace provides good overview of your heaps and allocators usage, and the game is kind of still playable while tracing which is a good plus. You could use MemTrace for profiling and optimizing your memory usage to decrease your memory consumption, and you could also use MemTrace for memory debugging in the case of a dreadful memory overwrite.
MemTrace UI is very responsive even with traces containing millions of events, which is a very big plus for memory tracing in video games.
If you found this blog post useful, follow me on Twitter to be notified when I post new content.